
Footprint charts, a unique form of candlestick charts, go beyond displaying only prices by incorporating additional information such as trade volume and order flow. This multidimensional tool offers shareholders valuable insights beyond security prices, gaining popularity among leading charting software vendors.
Understanding the Basics of Footprint Charts:
Footprint charts are intricate diagrams that enable traders to observe supplementary market indicators, including liquidity levels, volume, and bid-ask spreads, superimposed on a candlestick chart. Traders can tailor these charts to their preferences by including specific variables of interest.
Similar to traditional candlestick charts, traders can customize the timeframe of footprint charts to analyze security movements over short, intermediate, or long-term periods.
In essence, footprint charts allow the analysis of numerous variables within a single diagram and are considered multi-variable charts, akin to depth of market (DOM) or level 2 quote charts. Many advanced charting providers offer multi-variable quotation systems as add-ons to basic software subscriptions.
Market Delta, a prominent software producer, offers footprint graphs on a monthly subscription basis. The Market Delta platform integrates seamlessly with top brokerage firms, facilitating transaction automation. Additionally, Market Delta provides customizable data feeds for a fee.
Different Types of Footprint Charts:
Various footprint charts are available from charting suppliers, with some common types including:
-
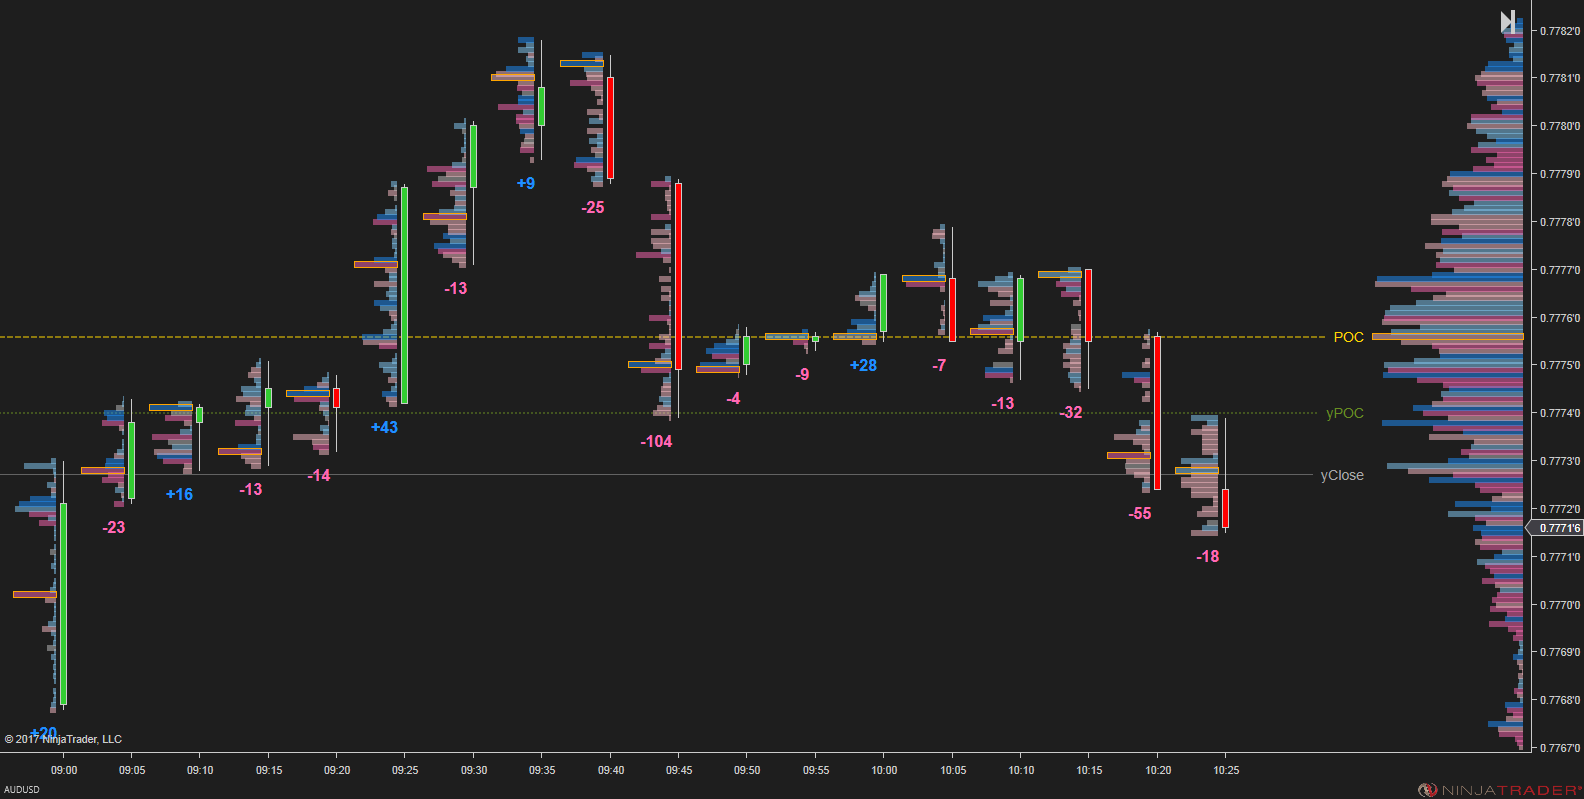
Footprint Profile: This chart displays a vertical histogram alongside regular footprint bars, indicating the number of trades at each price. It helps traders identify where liquidity is concentrated and at what prices.
-
Bid/Ask Footprint: Real-time volume is colorized to highlight buyers and sellers probing the bid or offer. This enables investors to discern whether buyers or sellers are influencing price movements.
-
Delta Footprint: Showing the net difference between bidder-generated and seller-launched volume at each price, the delta footprint assists traders in gauging the initiation and continuation of price trends.
-
Volume Footprint: Unlike typical volume histograms, this chart splits volume by value and time, aiding traders in identifying capitulation points.
Analyzing Order Flow Using Footprint Charts
Footprint charts offer contextual insights by delving into transaction volumes over a specific timeframe. During analysis, traders should look for signals indicating noteworthy prices based on transaction data. This can include imbalances, order blocks, and high-volume nodes, all serving as indicators of support or precursors to price changes.
The key to effective analysis lies in framing trades within context and considering the broader picture.
Conclusion:
Footprint charts streamline the trading process by providing a focused diagram that analyzes multiple variables. This tool empowers traders to make more informed decisions by offering a comprehensive view of the market landscape.
Source: https://www.patreon.com/posts/everything-you-85922401